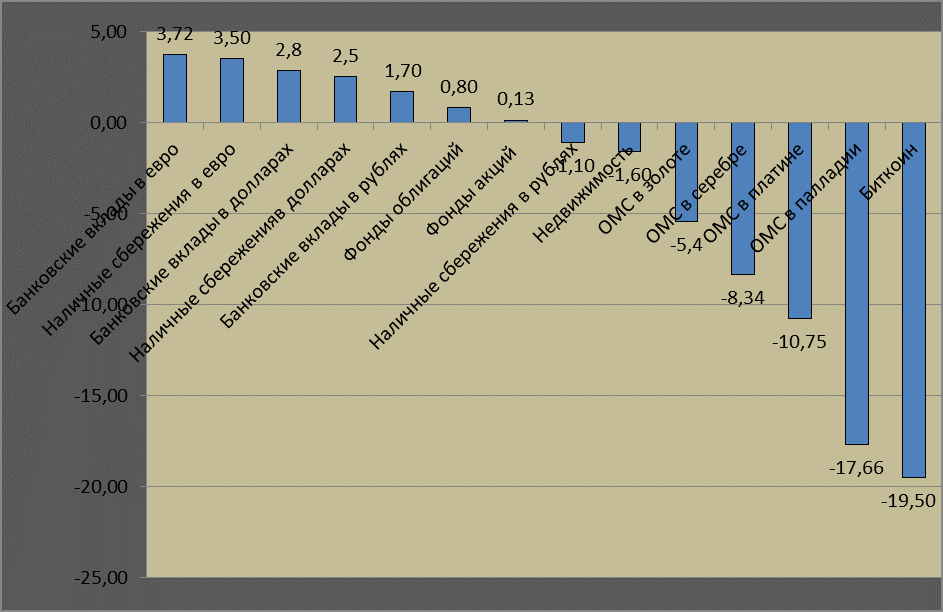
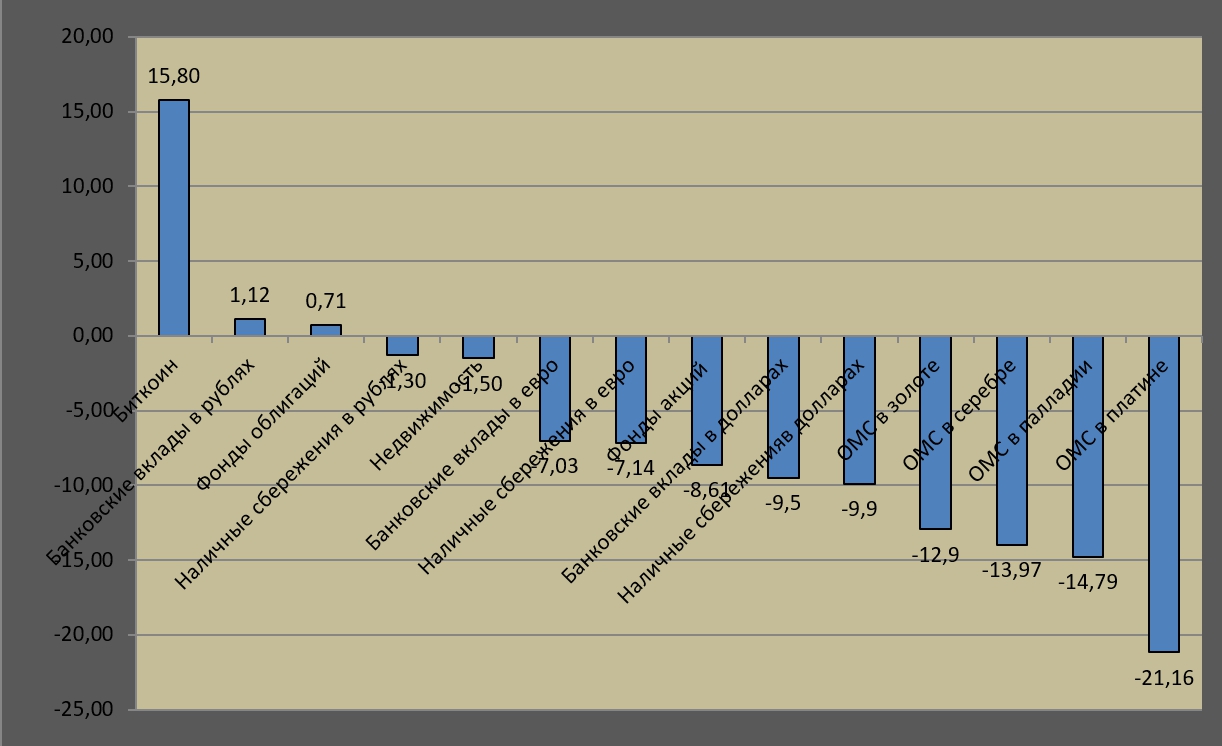
Ranking list in terms of return on investment tools
7 May 2018
Analytical service of FinExpertiza
RESEARCH GOAL
Determination of return on main investment tools for 4 months of 2018.
USED SOURCES
Rosstat data, National League of Management Companies, IRN.ru portal, CBR data, websites of top-10 banks of Russia.
BRIEF EXPLANATION
The research includes the calculation of real ruble return on main investment tools (ruble & foreign currency deposits, unit investment trusts, impersonal metal accounts, real estate in Russian regions), cryptocurrency.
INITIAL DATA
We have calculated the real ruble return on main investment (savings) tools (ruble & foreign currency deposits, unit investment trusts, impersonal metal accounts, real estate, cryptocurrency).
Table 1 Sale and purchase rates of investment tools
|
Name of investment tool |
Selling rate* as of 8 January 2018 (RUB per gram) |
Buying rate * as of 27 April 2018 (RUB per gram) |
|
USD |
58.83 |
60.95 |
|
Euro |
70.91 |
74.15 |
|
Gold |
2555 |
2444 |
|
Silver |
33.14 |
30.74 |
|
Platinum |
1875 |
1694 |
|
Palladium |
2150 |
1794 |
* Sberbank data for Moscow
Table 2 Average price in the primary real estate market of Russia
|
Name of investment tool |
Price per sq. meter at the end of 2017. RUB |
Price per sq. meter at the end of the first quarter 2018. RUB |
|
Real estate in Russia |
52 384 |
52133 |
* Rosstat data
Table 3 Bitcoin price dynamics
|
Popularity (in terms of capitalization) |
Cryptocurrency |
Cryptocurrency price as of 27 April 2018.$ |
Change for 3 months, $ |
Decline in price for 3 months, %% |
|
1 |
Bitcoin |
9144.24 |
2657.46 |
22.5 |
*https://icotime.ru/charts/kurs-bitcoin
RETURN OF MAIN TOOLS
IN TERMS OF INVESTMENT / SAVING
The table 4 below shows return on main elements of investment.
Ruble real return is the nominal return minus inflation amount for the investment period, minus overheads (for example, difference in the buying and selling prices of currency and metal).
Table 4 Return on main investment tools
|
Tools in Investment / Saving |
Nominal return since the beginning of the year (%%) |
Real return since the beginning of the year (%%) |
|
Cash savings |
||
|
RUB |
0 |
-1.1 |
|
USD |
3.6 |
2.5 |
|
Euro |
4.6 |
3.5 |
|
Bank deposits |
||
|
RUB |
2.80 |
1.70 |
|
USD |
0.34 |
2.84 |
|
Euro |
0.22 |
3.72 |
|
Open unit investment trusts (average weighted return) |
||
|
Equity funds |
1.23 |
0.13 |
|
Bond funds |
1.9 |
0.8 |
|
Alternative tools |
||
|
impersonal metal accounts, Gold |
-4.3 |
-5.44 |
|
impersonal metal accounts, Silver |
-7.2 |
-8.34 |
|
impersonal metal accounts, Platinum |
-9.7 |
-10.75 |
|
impersonal metal accounts, Palladium |
-16.6 |
-17.66 |
|
Real estate in Russia |
||
|
Real estate in Russia |
-0.5 |
-1.6 |
|
Cryptocurrency |
||
|
Bitcoin |
-22.0 |
-19.5 |
METHODOLOGY OF CALCULATION:
Cash savings
As for ruble cash, savings have depreciated by the amount of inflation. Those, who kept money in foreign currency in 2018. have gained. Due to the depreciation of the ruble, cash savings in USD and Euro rose by 3.6% and by 4.6% respectively since the beginning of the year (by 2.5% and 3.5% respectively, given the inflation).
Bank deposits:
Yield on bank deposits for four months (from January to April) has been calculated on the basis of the average annual yield on one-year deposits in the TOP-20 largest banks.
Table 5 Nominal yield of bank deposits
|
Bank deposits |
2018 |
|
RUB |
8.40 |
|
USD |
1.03 |
|
Euro |
0.65 |
Real yield on deposits is the annual yield in terms of four months minus the inflation amount. As for deposits in foreign currency, we add yield of relevant currency and yield of deposits.
Since the beginning of 2018. all depositors gained from their deposits.
- Bank deposit, RUB – 1.7%,
- Bank deposit, USD – 2.84%
- Bank deposit, Euro – 3.72%.
Open unit investment trusts
Since early 2018. equity funds and bond funds showed positive dynamics. Given the inflation, the real yield of bond funds and equity funds was equal to 0.8% and 0.13% respectively.
Alternative tools
Given the inflation, losses incurred by metal account holders range from 17.66% to 5.44%. Palladium has fallen the most, while Gold has fallen the least.
Real estate in Russia
The decline in prices continue unabated in the real estate market. The table 4 shows that the price of real estate for four months of 2018 without inflation has fallen by 0.5% on average in Russia.
However, there are regions that are now very attractive in terms of investment in real estate, namely Perm region, Republic of Crimea and Moscow. The rise in prices of real estate ranges from 13% to 30%.
Table 6 TOP regions with the highest dynamics in terms of price per sq. meter in the primary real estate market
|
Russian region |
Price per sq. meter in dwelling (typical), 2017 |
Price per sq. meter in dwelling (typical), 2018 |
Price dynamics, %% |
|
Perm region |
46 257 |
60 874 |
31.60 |
|
Republic of Crimea |
46 685 |
54 183 |
16.06 |
|
Moscow |
99 716 |
113 022 |
13.34 |
|
Kirov region |
34 969 |
38 700 |
10.67 |
|
Republic of North Ossetia-Alania |
32 887 |
36 186 |
10.03 |
|
Saint Petersburg |
89 613 |
98 206 |
9.59 |
Cryptocurrency
In this research, we have considered the most popular currency, Bitcoin. For the current year, its value in USD fell by 22% (by 19.5%, given the growth of the dollar exchange rate).
As a side note, among the TOP-10 cryptocurrencies ranked by popularity (capitalization), nine cryptocurrencies showed a negative yield. Bitcoin is the fifth in the ranking list of currencies in decline.
|
STATISTICS , 3 MONTHS of 2018 |
||||
|
Popularity (in terms of capitalization) |
Cryptocurrency |
Cryptocurrency price as of 27 April 2018 |
Change for 3 months, $ |
Decline in price for 3 months, %% |
|
10 |
NEO |
74.49 |
76.39 |
50.6 |
|
2 |
Ethereum |
666.53 |
551.11 |
45.3 |
|
6 |
Ripple (XRP) |
0.8267 |
0.4633 |
35.9 |
|
7 |
EthereumClassic (ETC) |
21.38 |
11.63 |
35.2 |
|
1 |
Bitcoin |
9144.24 |
2657.46 |
22.5 |
|
9 |
Monero (XMR) |
256.06 |
74.41 |
22.5 |
|
5 |
Litecoin (LTC) |
148.74 |
42.49 |
22.2 |
|
4 |
BitcoinCash |
1363.5 |
365.64 |
21.1 |
|
8 |
IOTA (IOT) |
1.99 |
0.49 |
19.8 |
|
3 |
EOS |
17.49 |
3.06 |
14.9 |
Diagram 1. Return on main investment tools from January to April, 2018

|
Bank deposits, Euro |
|
Cash savings, Euro |
|
Bank deposits, USD |
|
Cash savings, USD |
|
Bank deposits, RUB |
|
Bond funds |
|
Equity funds |
|
Cash savings, RUB |
|
Real Estate |
|
impersonal metal accounts, Gold |
|
impersonal metal accounts, Silver |
|
impersonal metal accounts, Platinum |
|
impersonal metal accounts, Palladium |
|
Bitcoin |
Diagram 1 Return on main investment tools from January to April, 2017

|
Bitcoin |
|
Bank deposits, RUB |
|
Bond funds |
|
Cash savings, RUB |
|
Real Estate |
|
Bank deposits, Euro |
|
Cash savings, Euro |
|
Equity funds |
|
Bank deposits, USD |
|
Cash savings, USD |
|
impersonal metal accounts, Gold |
|
impersonal metal accounts, Silver |
|
impersonal metal accounts, Palladium |
|
impersonal metal accounts, Platinum |

